La ricerca in provincia di Latina - Gruppo Inanellamento Limicoli (GIL, Napoli)
Menu principale:
- Home Page
- L'Associazione
-
Ricerche in atto
- Migrazione autunnale Allodola
- Migrazione primaverile Tordo
- Ali Tordo bottaccio in Campania
- Stazione Monte Vaccaro
- Riserva Naturale Foce Volturno
- Inanellamento Medio Volturno
- Avifauna svernante
- Avifauna Foce Neto e Sila
-
Ricerche concluse
- Ali Turdidi e Beccacce ATC LT 2
- Stazione Malga Rosello
- Migrazione Caradriiformi
- Progetto Rondine
- Migrazione autunnale Tordo
- Ali Turdidi e Beccacce ATC CE
- Progetto Alauda 2000
- Osservatorio Roccolo Ganda
- Atlante Migrazioni Puglia
- Download
- News
La ricerca in provincia di Latina
Timing of the spring migration of the Song Thrush Turdus philomelos through southern Italy
Abstract from: The Ring (2014) 36: 23-
The project was based on standardized mist-

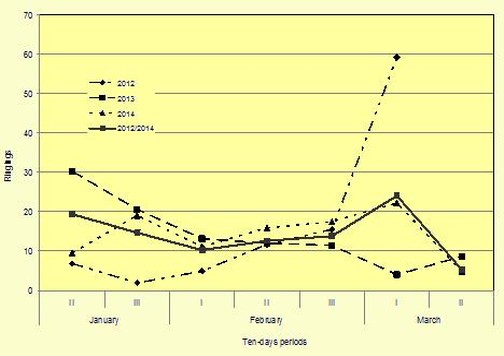
Figure 1. Trapping patterns (%) per 10-
In the three years the number and distribution of catches show quite different trends. In 2012 the recorded catches in the first three 10-
The observations made in the area surrounding the nets during the working hours of the ringing station basically followed the trend of catches. The number of sightings is indicative of the wintering individuals passing through the ringing station at sunset to reach roosting sites. Throughout the study period 7,255 birds were counted: 1,009 in 2012, 5,082 in 2013 and 1,164 in 2014.
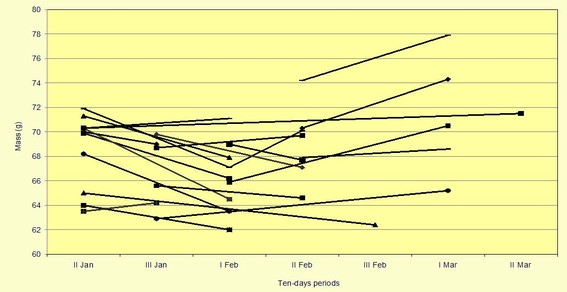
Of the 341 thrushes ringed over three years, 39 were controlled of which 10 were one year and two were two years after first ringing; in addition, 12 recaptures were made after a period of 1 to 8 days and 20 after a period of 13 to 56 days. The examination of the body mass of these individuals showed, for all birds ringed by the end of February a decrease of 1.0 to 5.8 g or a minimal increase of 0.7 to 1.0 g while individuals taken in March showed an increase in weight of 0.7 to 4.6 g (Figure 2).

Figure 2. Changes in weights (g) of individual Song Thrush, years 2012-
Weights of the same birds measured on different occasions are connected with a line.
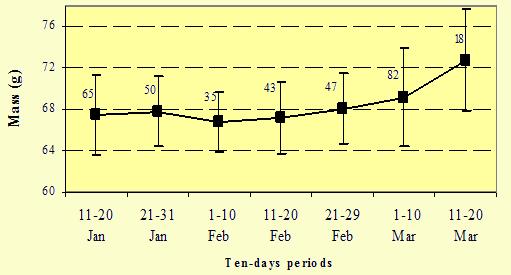
Figure 3 shows the average body mass trend per 10-

Figure 3. Variation of mean body mass, per 10-
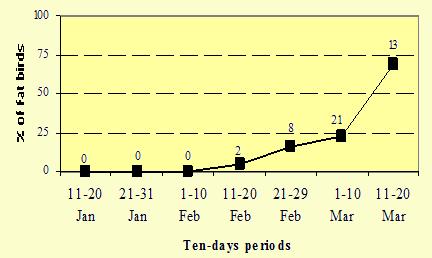
Since the increase of the body mass depends on fat deposit, figure 4 shows the percentage of subjects with a score of fat greater than or equal to 3, calculated per 10-

Figure 4. Fat expressed as percentage of birds with amount of visible fat scoring at least 3, per 10-
The graph shows the percentage of birds with fat deposits scoring at least 3 including those recaptured in each 10-
Mean wing lengths, third primary and tarsus lengths calculated for the three years and for all years combined are presented in Table 1. The samples of the years 2013 and 2014 also including data of birds ringed during the previous year.
year |
wing |
third primary |
tarsus |
2012 |
118.8 ± 2.82 |
89.2 ± 2.34 |
32.4 ± 0.85 |
2013 |
118.9 ± 2.50 |
88.9 ± 2.25 |
32.4 ± 0.89 |
2014 |
118.7 ± 2.82 |
88.7 ± 2.56 |
32.5 ± 0.89 |
all years |
118.8 ± 2.67 |
88.9 ± 2.34 |
32.5 ± 0.88 |
Table 1. Biometric measurements (in mm) of the Song Thrushes ringed during the period 11 January/20 March, 2012–2014, and sample sizes. |
|||
Values obtained for the three morphometric variables did not differ from year to year. The biometric measurements suggest that the population of thrushes visiting the area is fairly homogeneous in size. In particular the mean wing length recorded for birds captured during this study is consistent with the values obtained in the period from January to March in the province of Salerno in Campania (118.6 mm during 2013 and 118.7 mm during 2014) (Scebba 2014) and in the years 1997-
The spatial analysis of data of birds ringed in other countries during the breeding season and recovered in Latium indicates one main area of origin of the marked population centred in central-
The data collected indicate that the study area is mainly visited by wintering thrushes that concentrate at the site of capture by moving from pastures to night-
When the autumn migration is over, the birds wintering in the area remain during the months of January and February and sometimes until March, as confirmed by the recoveries which occurred in early March of thrushes which were ringed in January. In addition, recovery data occurred after a period of one or two years showed that several individuals were faithful to the wintering area.
The analysis of average body mass and fat of birds examined during the present study showed that only from the end of February did the birds show significant increases in weight, due to the deposit of fat necessary for the migration, consistent with the onset of the hyperphagia phase. Remarkable in this respect is the weight change of the thrushes recaptured in the same season: the majority of subjects taken until the second 10-
These data also differ from what was found by Licheri and Spina (2002), which showed, instead, an increase in fat levels as early as the third 10-
On the basis of information gathered during the three years of investigation it is possible therefore to assume that, for Latium, in the study area, and for southern Italy in general, by January 31 the pre-
REFERENCES
Licheri, D., Spina, F. (2002) Biodiversità dell’avifauna italiana: variabilità morfologica nei Passeriformi (parte II: Alaudidae – Sylviidae). Biologia Conservazione Fauna 112: 1-
Scebba S. (2014) Studio per la determinazione della data d’inizio della migrazione prenuziale del Tordo bottaccio in provincia di Salerno. II Resoconto. Ambito Territoriale di Caccia Salerno 1: 1-
Scebba S., Moschetti G. (2000) Biometria e rapporto giovani/adulti nel Tordo bottaccio Turdus philomelos
Scebba S., Soprano M., Sorrenti M. (2014) Timing of the spring migration of the Song Thrush Turdus philomelos through southern Italy. Ring 36: 23-